Image-a-Day
|Ongoing project where each participant shares an image with every other every day. In 2009 I added code to a software program that “collages” information from my day, including photos, text, website browsing history, music I listened to, number of key presses and mouse clicks, etc. It transforms this information into a single image that is then posted onto a website.
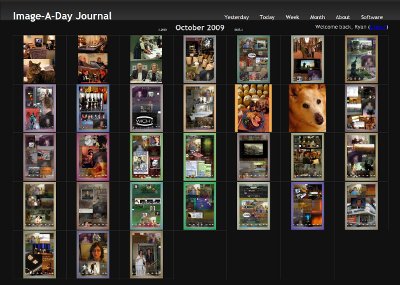
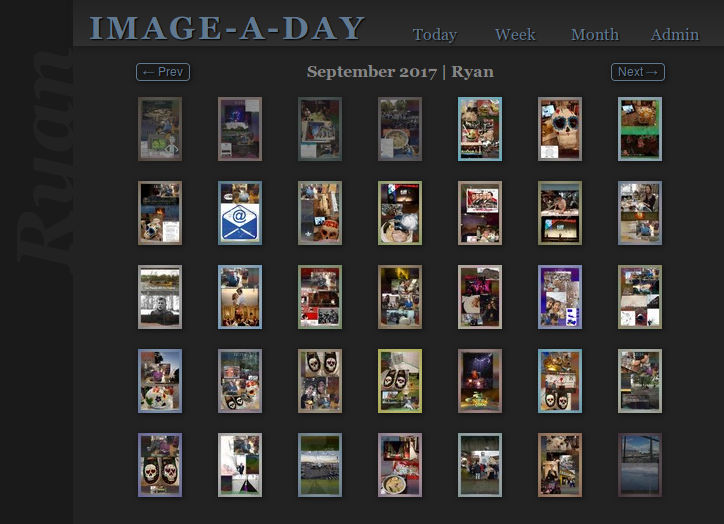
Month view on the Image-A-Day website
This work came out of desire to challenge myself to create art every day for a year. I wanted to write software but I also wanted a project that my friends and family could join. Thus was born the Image-A-Day Journal: a website where participants could upload and share an image every day. The only rule was that you had to upload an image each day.
My software became a “collager”: I “feed” it images and text from my day and it manipulates and positions them. I eventually added a number of features that collaged additional details about my day: websites I visited, number of key presses and mouse clicks, music I listened to, news and weather, etc. Through the medium of digital collage this information is shared with the other members of the project.
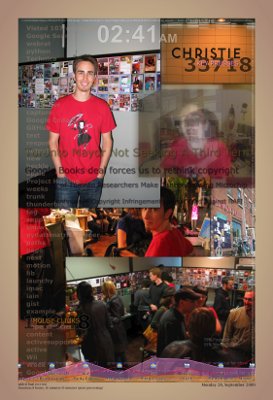
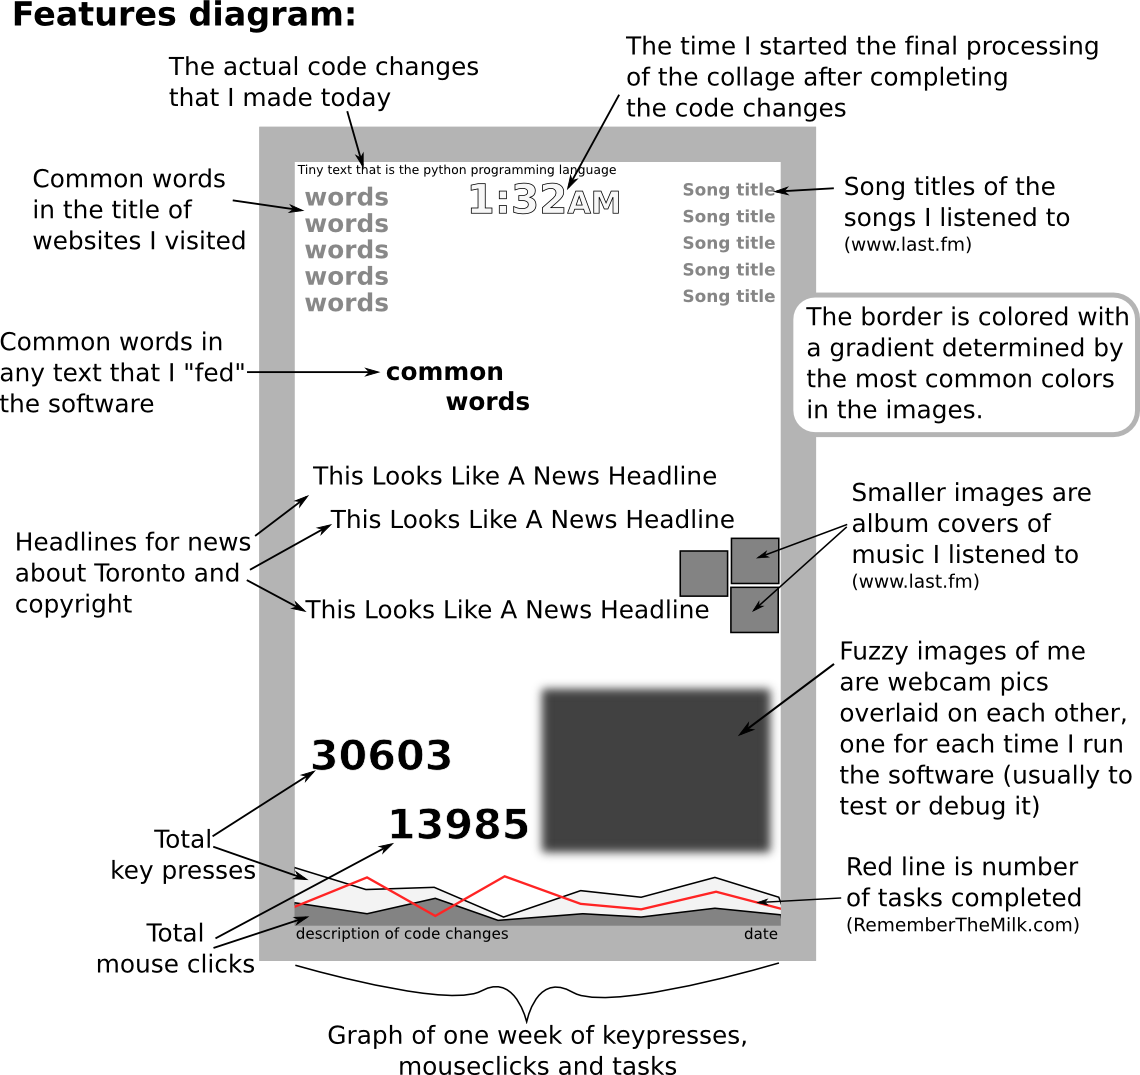
Example of an automatically generated collage
This project explores how people change as their lives become more documented and as they participate and share in artistic practice every day.
Collager Features
Currently implemented features:
IMAGES
- Process images (jpg, png)
- Thanks to Python Imaging Library
- Detect common colours in images and set border, text, and background gradient from these
- Smart image scaling to adapt to different sized images
- Smart image scaling to adapt to number of images to collage and their relative sizes
- Place “recurring” images behind today’s unique images
TEXT
- Process text files
- Process html files
- Thanks to Beautiful Soup
- Find common words in text
- Thanks to the Natural Language Toolkit (nltk)
- Find titles in text
TRACKING
- Track websites visited and extract common words (from Firefox)
- Track songs listened to and display names and images of albums (from Last.FM)
- Thanks to python-lastfm
- Track tasks completed (from RememberTheMilk.com)
- Thanks to Sridhar Ratnakumar and his pyrtm library
- Track time spent on computer
- Thanks to Project Hamster
- Track number of mouse clicks and key presses
- Thanks to Workrave
- News headlines (from Google News)
- Thanks to the Universal Feed Parser
- Current weather (Yahoo weather or Google weather)
- Thanks to the Python Weather API
- Take a snapshot from webcam each time the software is run
- Thanks to Fredrik Portström and the python-v3l2-capture project
- Display time that final run of software started (to encourage me to go to bed earlier)
MISCELLANEOUS
- Display code changes in spiral path around border (from git)
- Display how much time taken working on today’s code
- Display how much time taken executing/processing today’s collage
- Plot a line graph of tasks completed, mouse clicks and key presses